Monthly backtest series · Momentum Strategy of Vanderholt Technologies

Momentum strategy backtest,
November 2026.

This page is refreshed every month with a new run of the same momentum book. The November 2026 edition covers 2 January 2024 to 30 October 2026, 711 trading sessions: a 10-name equal-weight long-only sleeve returned 381% against 60% for the benchmark—321 percentage points of excess return. Daily Sharpe, Sortino and Calmar still favour the book, and the Calmar ratio is about twice the benchmark’s. The month itself did not. October was −20.7% against −0.9% for the index, the trailing year is now behind, and monthly Sharpe favours the benchmark. Every chart, table, trade statistic and holding below comes from that single run. December will replace them with the next one.

Quantitative Research Desk November 2026 edition Updated monthly Internal research run
+381%
Total return
Benchmark +60%
74.4%
CAGR
Benchmark 18.1%
1.39
Daily Sharpe
Benchmark 1.15
+321 pp
Excess vs benchmark
Calmar 1.93 vs 0.95

At a glance

Twelve numbers that describe the run.

Before the narrative, the scorecard. Each figure below is read from this run’s artefacts; the derivations are explained in the sections that follow. The first column is what a return-seeking allocator looks at. The second is what a risk officer looks at. Both columns belong to the same book.

Return Value Risk and discipline Value
Total return, 2.8 years+381.3%Maximum drawdown−38.6%
Compound annual growth rate74.4%Annualised daily volatility48.9%
Every calendar year positive2024 +161%, 2025 +48%, 2026 +25% YTDBeta to benchmark2.02
252-session windows positive99.6% of 459; latest −8.2%Worst single day−11.7%
Months up23 of 34Months beating the benchmark23 of 34
Round-trip win rate69.4% (320 round trips)Average winner / average loser+47% / −13%

The case for momentum

Winners tend to keep winning—if you can hold them.

Cross-sectional momentum is one of the few equity premiums that has survived decades of out-of-sample tests. Jegadeesh and Titman (1993) documented that ranking stocks on trailing returns and holding the winners produces a persistent spread; Carhart (1997) made it the fourth factor in the standard asset-pricing model; Asness, Moskowitz and Pedersen (2013) showed the same pattern across equities, bonds, currencies and commodities in Value and Momentum Everywhere. Information diffuses slowly, positioning crowds into recent leaders, and analysts revise in the direction of the last surprise. A systematic book that re-ranks on a schedule captures that persistence without a narrative for each name.

That is why momentum sits first in Vanderholt’s prediction stack. It is measurable and replayable. It does not require a view on fair value. It does require a universe screen, a volatility cap, and equal weights so a handful of lottery tickets cannot dominate the P&L. It also requires the discipline to sell a name the month its rank falls, which is where most discretionary attempts at trend following fail. The Momentum Strategy of Vanderholt Technologies is exactly that discipline, expressed as code: a three-horizon momentum score, long-only, equal-weight, on a liquid US book, rebalanced on the first trading day of every month.
The score blends a 21-day rate of change (near-term impulse), a 252-day rate of change (the trend that institutions warehouse), and a 126-day return (the intermediate horizon that the academic literature finds carries most of the premium). Names that score on all three enter the book. A name that has rallied for a year but rolled over in the last month scores lower than one still accelerating. That is deliberate; the 21-day leg is what gets the book out of a tired leader before the 252-day leg notices.

Construction

How the 10-name book is built.

  • 1. Universe screen

    Top 500 names by dollar volume over a 730-day lookback, then the top 75 by raw momentum. Minimum average volume 100,000 shares, last price at least $5, average price at least $4, at least 504 trading days of history. Volatility filter at 25%—lottery tickets are excluded before ranking. Sixty-eight names cleared the screen at the 1 October rebalance, which is the last rebalance in this run.

  • 2. Momentum score

    Each surviving name is scored on the three-horizon momentum blend and ranked descending. The book is the 10 highest scores. The score is the ranking key, not a size overlay: rank 1 and rank 10 receive the same weight. No sector constraint, no fundamental filter, no discretionary override.

  • 3. Equal-weight, long only

    Ten positions at 10% each, rebalanced on the first NYSE session of the month shortly after the open. No shorts, no leverage, no stop-loss; gross and net exposure sit at 1.0x. $200,000 starting capital, half-cent per share commission and a one-cent spread slippage model. Thirty-four rebalance days are in the blotter. The simulated path has no November rebalance. The names selected for November, scored on 30 October, are in the current-book section.

ParameterSettingWhy it matters
Backtest window2 Jan 2024 – 30 Oct 2026 (711 sessions, 2.8 years)Two full calendar years, ten months of 2026, and a full October
Calendar / frequencyNYSE, daily bars, 756-day data windowEnough history for the 252-day leg plus the 504-day listing requirement
RebalanceFirst trading day of each month, after the openThirty-four rebalances; the last one is 1 October 2026
Positions / weight10 × 10.0%Concentrated enough to express the factor, diversified enough that one name is capped at a tenth
UniverseVolume top 500 → momentum top 75 → 68 survivorsLiquidity first, then factor pre-selection
Volatility cap25%Removes the most explosive names before they can be ranked
Costs$0.005 per share commission, $0.01 spread slippage$5,903 total on $19.4 million traded; about 3 basis points of notional
BenchmarkSPYSame calendar, same window, same growth-of-100 basis
Stop-lossNoneExits are driven by rank only; the drawdown numbers below are unassisted

The path of wealth

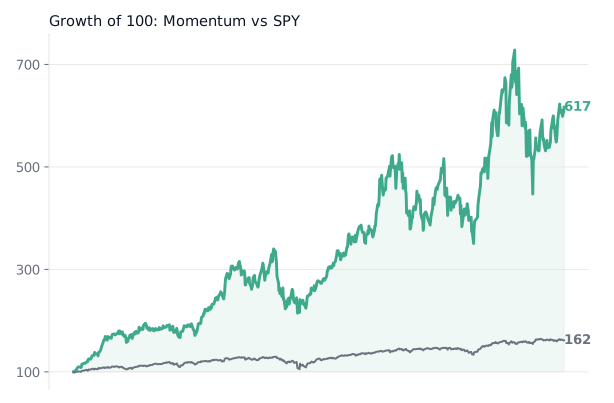
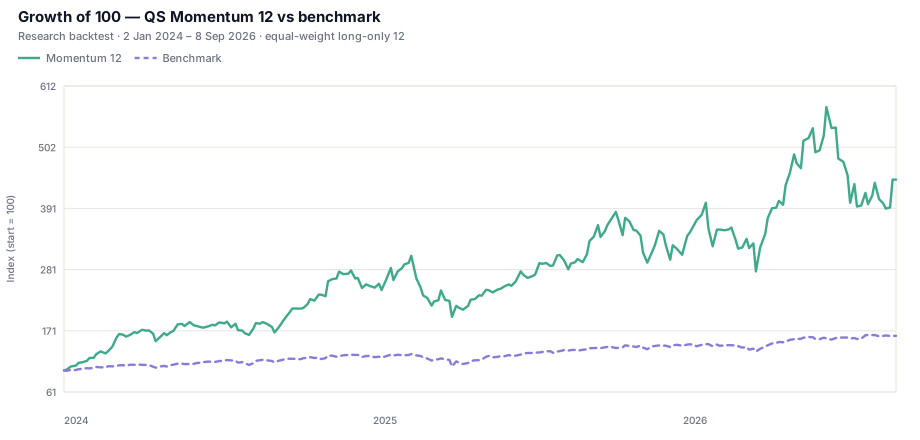
$100 became $481. The benchmark became $160.

Indexed to 100 at the open of 2 January 2024, the 10-name book finished 30 October 2026 at 481.3. The benchmark finished at 159.9. Peak wealth on the strategy is still 728.1, set on 22 June 2026. In dollars: $200,000 compounded to $1,456,219 at the peak and $962,611 at the close of the window. The ending point sits 33.9% below the high-water mark.

The curve is plotted on a log scale so that the slope reads as a growth rate. 2024 was the steepest year, compounding 161%. The 2025 spring correction cost 36.9% peak-to-trough and was recovered by July. April and May 2026 took the book to its high; July gave a third of it back. By 30 September the book had climbed back to 606.7, about 16.7% under the June high. October took it to 481.3. That month reopened the hole. It did not set a new trough: the maximum drawdown is still −38.6%, printed on 29 July 2026.

On this growth-of-100 basis the strategy has never closed a session behind the benchmark, across all 711 sessions. It has been below its starting value on one session only, 3 January 2024.

Equity curve of the 10-name Momentum Strategy versus the benchmark, January 2024 to 30 October 2026, log scale.
Growth of 100, log scale. Source: November 2026 backtest of the Momentum Strategy of Vanderholt Technologies, 10-name sleeve, through 30 October 2026, modelled costs included.

Benchmark comparison

The long sample is still ahead. The recent windows are not.

Total return, CAGR, daily Sharpe (1.39 vs 1.15), daily Sortino (2.23 vs 1.92) and Calmar (1.93 vs 0.95) still favour the book. Year to date is +24.5% against +10.8%. That is the whole of the good news on horizon returns. The trailing year is −2.8% against +11.2% for the benchmark. Six months are −7.6% against +5.2%. Three months are −6.5% against +1.9%. October, a full month in this run, was −20.7% against −0.9%.

Monthly Sharpe has crossed over: 1.27 for the book against 1.42 for the benchmark. The edge that remains is a daily-compounding edge inside a much more volatile series, visible over the full sample and over the calendar years, and absent from every window shorter than the year to date.

Maximum drawdown is −38.6% against −19.0%. Daily volatility is 48.9% against 15.5%, 3.2 times the index. A book of the ten strongest names gives back more when those names reverse together, and in October they did.

Metric Momentum 10 Benchmark Edge
Total return381.3%59.9%+321.4 pp
CAGR74.4%18.1%+56.3 pp
Daily Sharpe1.391.15+0.24
Daily Sortino2.231.92+0.31
Monthly Sharpe1.271.42−0.15
Calmar1.930.95+0.98
One year−2.8%+11.2%−14.0 pp
Year to date24.5%10.8%+13.7 pp
Six month−7.6%+5.2%−12.8 pp
Three month−6.5%+1.9%−8.4 pp
October 2026−20.7%−0.9%−19.8 pp
Max drawdown−38.6%−19.0%Deeper path risk
Daily volatility (annualised)48.9%15.5%3.2× the index
Best day / worst day+15.0% / −11.7%+10.5% / −5.9%Wider tails
Best month / worst month+37.0% / −25.7%+10.5% / −5.9%Wider tails
Avg. up month / down month+13.6% / −11.3%+3.4% / −2.1%Asymmetric months
Average drawdown / duration−6.7% / 21.5 days−1.6% / 12.2 daysLonger underwater spells
Daily skew / excess kurtosis−0.37 / 1.6+0.96 / 21.6Fatter body, thinner extreme tail
Positive days58.9%55.8%+3.1 pp
252-session windows positive99.6%Latest +9.9%Strategy latest −8.2%

Horizon returns, Sharpe, Sortino, Calmar, volatility, skew, kurtosis and drawdown statistics are taken from the run’s portfolio statistics table. The 252-session row is computed from the daily return series, because that is the window drawn in the chart below; it is a different window from the official trailing one-year figure of −2.8%. The benchmark’s kurtosis of 21.6 reflects a single +10.5% session on 9 April 2025. The strategy’s best day was 30 July 2026 and its worst was 5 June 2026.

Calendar years

Still ahead in every year. 2026’s margin is much smaller.

The strategy beat the benchmark in every calendar year of the sample, including 2026 year to date. 2024 was +161.1% against +24.0%. 2025 was the hard year: a −36.9% drawdown from mid-February to early April, a recovery by July, a strong September (+19.7%), then a November payback (−17.0%). The book still finished +48.0% against +16.4%. 2026 through 30 October is +24.5% against +10.8%. April and May built that lead. July and October gave most of the excess back.

The two completed years were +161% and +48%. A CAGR of 74% is an average of very different years, and 2026 is a third kind of year: still ahead of the index, with two months left, after a single month that cost about a fifth of the book.

YearMomentum 10BenchmarkExcessWorst monthBest monthSignal IC (21-day)
2024+161.1%+24.0%+137.1 ppDec −14.0%Feb +25.5%0.158
2025+48.0%+16.4%+31.7 ppNov −17.0%Sep +19.7%0.005
2026 YTD (30 Oct)+24.5%+10.8%+13.7 ppJul −25.7%Apr +37.0%0.117

Calendar-year returns are compounded from daily returns. Signal IC is the mean Spearman rank correlation between the momentum score and the following 21 trading days’ return, across the screened universe, for the evaluation dates that fall in that year. The 2025 reading is discussed in the signal section.

Risk decomposition

About two units of beta, and a residual that beta does not explain.

A regression of the book’s daily returns on the benchmark gives a beta of 2.02 and a daily correlation of 0.64. The high beta is structural: ten equal-weight positions in the fastest-rising stocks will carry more market exposure than the index. The residual, annualised from the daily intercept, is about +37% a year over this sample. After charging the book for two units of market risk, a large share of the full-sample return is still unaccounted for by the index. That residual is a sample estimate. October is a reminder that it is not a run-rate.

Capture ratios tell the same story with the recent damage included. On days the benchmark rose, the strategy rose 2.50 times as much on average. On days the benchmark fell, it fell 2.18 times as much. The up-capture still exceeds the down-capture. The down-capture is still greater than two. This is not a hedge, and October did not make it one.

MeasureMomentum 10BenchmarkReading
Beta to benchmark (daily)2.021.00Two units of market risk
Annualised residual return (alpha)+37.4%—Sample estimate, not a forecast
Daily correlation to benchmark0.641.00Moderate; monthly correlation 0.72
Up-capture / down-capture2.50 / 2.181.00 / 1.00Up-capture still larger
Daily 95% VaR (historical)−5.6%−1.5%One day in twenty loses more
Daily 95% CVaR (expected shortfall)−7.3%−2.2%Average of the worst 5% of days
Days worse than −5%431About one a month
Days better than +5%281Right tail is nearly as fat as the left
Gross / net leverage1.00 / 1.00—Unlevered, long only

Beta, alpha, correlation, capture and VaR are computed from the run’s daily return series against the benchmark over the same 711 sessions. Alpha is the annualised intercept of the daily regression.

Path risk

The worst drawdown did not get worse. The recovery did.

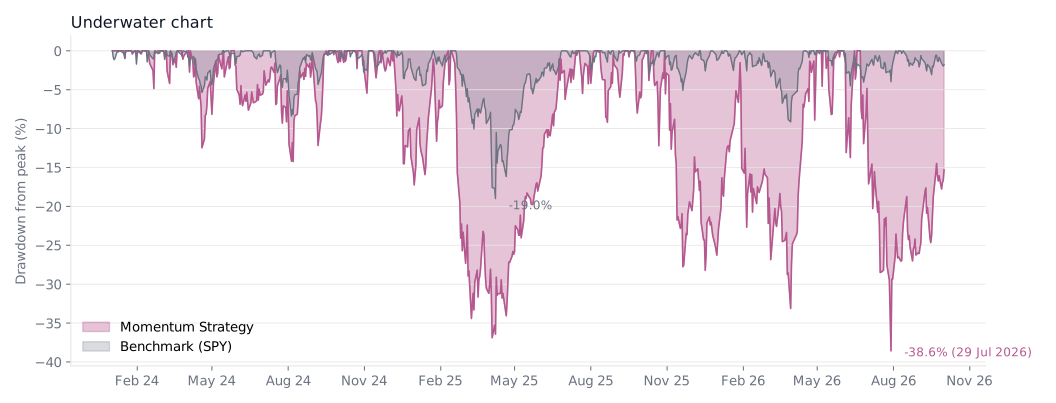
The run’s own average drawdown is −6.7% and lasts 21.5 trading days, against −1.6% and 12.2 days for the benchmark. The worst peak-to-trough remains 38.6%, from the 22 June 2026 high to 29 July 2026, 37 calendar days. The benchmark’s worst was 19.0%, from 19 February 2025 to 8 April 2025. The strategy has now been below its June high for 130 calendar days and sits 33.9% under it.

October did not print a new low. At the end of September the book was about 16.7% under the June high. October opened that gap back out to 33.9%, still above the July trough. An allocator reading this sample should expect roughly one drawdown of 30% or more per year, and a recovery measured in months. This one is four months old and has given back its partial recovery.

Drawdown from peak for the Momentum Strategy versus the benchmark, through 30 October 2026.
Underwater chart. The strategy bottom is still −38.6% on 29 July 2026. The line ends at −33.9%, after October reopened a drawdown that had narrowed to about 17%.
#PeakTroughRecoveredDepthPeak to troughTotal underwater
122 Jun 202629 Jul 2026Not yet−38.6%37 days130 days and counting
214 Feb 20254 Apr 202514 Jul 2025−36.9%49 days150 days
329 Oct 202530 Mar 20261 May 2026−33.1%152 days184 days
46 Dec 202431 Dec 202410 Feb 2025−17.2%25 days66 days
528 May 20247 Aug 202419 Sep 2024−14.2%71 days114 days
—Benchmark, worst episode: 19 Feb 2025 → 8 Apr 2025 → 27 Jun 2025−19.0%48 days128 days

Durations in calendar days, measured on the growth-of-100 series. The open episode’s underwater count runs from 22 June 2026 to 30 October 2026.

What October cost, and what the summer cost

The run decomposes drawdown days into a benchmark component, a selection component and a sizing component. From 22 June to 29 July the benchmark component was almost nil. Selection accounts for about 90% of that decline and sizing for about 8%. Across the full sample the same pattern holds: selection is 88% of the summed components, the benchmark 5% and sizing 7%.

October’s 22 drawdown days are the same story with the sign of the index flipped. The benchmark component was positive, a small cushion, while selection was largely negative and sizing a smaller drag. The names that did the damage are the names the book held. In points of starting capital, October’s largest subtractions were United Microelectronics (−22), SanDisk (−22), Applied Optoelectronics (−17), Western Digital (−12), Dell (−12), Micron (−10) and AMD (−10). The index fell 0.9% that month. The book fell 20.7% because its holdings did.
Consistency

The rolling year has gone negative. Almost every earlier window was positive.

Across 459 rolling windows of 252 trading sessions, the strategy’s trailing return was positive in 99.6% of them and ahead of the benchmark in 96.7%. The minimum and the latest reading are the same number, −8.2%. The benchmark’s latest 252-session return is +9.9%, and its worst was −4.2%. This is the first edition in which a completed 252-session window for the strategy is negative. The official trailing-year figure in the table above, −2.8% against +11.2%, is a different window and points the same way.

Over rolling 63-session windows the result is noisier: positive 70.8% of the time and ahead of the benchmark 64.7% of the time. The latest 63-session print is −10.1% against −0.3%. The tear sheet’s three-month figure, −6.5% against +1.9%, is the official horizon return and is the number in the comparison table. The chart is the 63-session window.

The rolling 126-session Sharpe has ranged from −0.58 to 4.68. It is now 0.03, against 0.84 for the benchmark over the same sessions. The strategy’s rolling Sharpe exceeded the benchmark’s in 59.5% of windows. The full-sample daily Sharpe of 1.39 is an average across regimes. The compounding edge in this sample comes from the size of the good windows, and October took a large one away.

Rolling 252-session returns for the Momentum Strategy versus the benchmark.
Rolling 252-session return. Positive in 99.6% of 459 windows. The minimum and the latest reading are both −8.2%.
Rolling 63-session returns for the Momentum Strategy versus the benchmark.
Rolling 63-session return. Teal shading is strategy ahead; pink is behind. The latest print is −10.1% versus −0.3% for the benchmark.
Rolling 126-session Sharpe ratio for the Momentum Strategy versus the benchmark.
Rolling 126-session Sharpe. The dashed line is the full-sample daily Sharpe of 1.39. The latest reading is 0.03, against 0.84 for the benchmark.

Calendar

Monthly returns, 2024–2026.

2024 compounded +161.1% with three losing months. 2025 finished +48.0% with February, March, November and December negative. 2026 year to date through 30 October is +24.5%. April was +37.0% and May +24.9%. July was −25.7%, the worst month of the sample, in a month the index finished flat. October was −20.7%, the second-worst month, in a month the index fell 0.9%.

Up months average +13.6% and down months average −11.3%, the averages reported by the run. Twenty-three of thirty-four months were positive and twenty-three of thirty-four beat the benchmark. The benchmark heatmap underneath shows how little of July or October was the index.

Momentum 10JanFebMarAprMayJunJulAugSepOctNovDecYear
2024 20.1 25.5 14.7 −2.1 9.5 −0.8 0.6 4.8 13.0 15.7 19.9 −14.0 161.1
2025 11.9 −10.8 −10.2 7.3 11.7 18.2 10.7 3.5 19.7 12.0 −17.0 −8.5 48.0
2026 15.1 −0.9 −13.8 37.0 24.9 6.5 −25.7 4.8 12.6 −20.7 — — 24.5
BenchmarkJanFebMarAprMayJunJulAugSepOctNovDecYear
2024 2.2 5.2 3.0 −4.0 5.1 3.2 1.2 2.3 1.8 −0.9 6.0 −2.7 24.0
2025 2.7 −1.3 −5.9 −0.9 6.3 4.8 2.3 2.1 3.3 2.4 0.2 −0.2 16.4
2026 1.5 −0.9 −5.2 10.5 5.3 −1.3 0.0 2.7 −0.6 −0.9 — — 10.8

Figures in percent, compounded from daily returns. January 2024 runs from the 2 January open. October 2026 is a full month. The strategy heatmap is scaled to ±30% and the benchmark heatmap to ±10%, so colour intensity is comparable within each table and not across them.

Bar chart of monthly returns for the Momentum Strategy and the benchmark, side by side, through October 2026.
The same months as paired bars. July 2026 was flat for the index. October 2026 was −0.9% for the index and −20.7% for the book.

Signal efficacy

The score still ranks the next month. October did not repeal that.

A portfolio return can be luck. A signal that ranks a whole universe correctly, month after month, is a separate question. At each evaluation the run records the Spearman rank correlation between the momentum score and the subsequent return of every name in the screened universe, together with the return spread between the top and bottom fifths. Both are measured at 5, 10, 21 and 63 trading days.

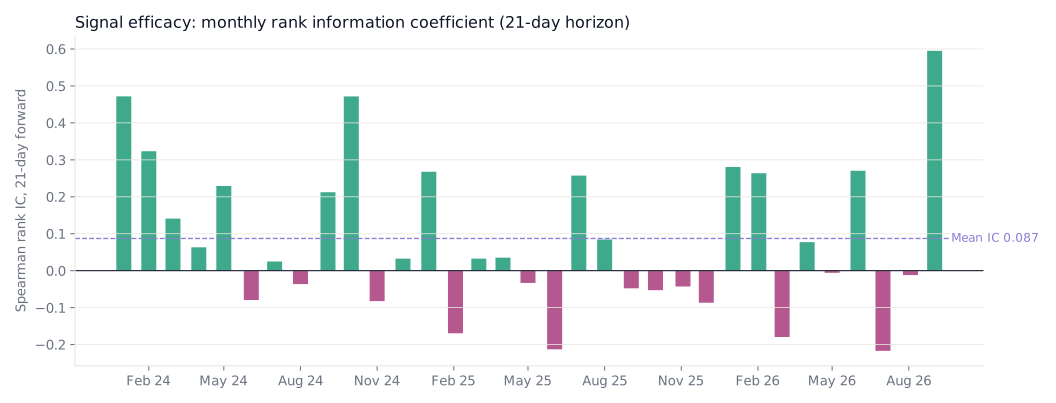
At the 21-day horizon, the one the book is rebalanced on and the one marked as the pre-registered primary endpoint, the mean IC over 34 evaluations is 0.087, with an IC information ratio of 0.44. The score was positive in 20 of the 34 months. The top quintile returned 5.9% on average and the bottom quintile 2.0%, a 3.9 percentage-point spread. A moving-block bootstrap of 1,000 resamples places the 95% interval for the IC at 0.024 to 0.155, with 99.8% of resamples positive and a p-value of 0.003. The spread’s interval is 0.8 to 7.1 percentage points, p-value 0.004. The run marks the IC row primary and the spread row confirmatory. Both intervals exclude zero.

The 5- and 10-day ICs are marked under the run’s false-discovery procedure, but their adjusted p-values are 0.072 and their intervals include zero. The quintile spreads at those horizons are not marked significant, and their intervals include zero as well. The 63-day horizon has a higher hit rate and only ten independent evaluation periods; the run stamps it limited history and reports no interval. The bootstrap file carries a limited-history availability stamp of its own. We report the 21-day numbers as the registered endpoint, and we do not treat the shorter or longer horizons as settled.

Spearman rank information coefficient of the momentum score at a 21-day forward horizon, 2024 to October 2026.
Rank IC at the 21-day horizon, 34 evaluations. Positive in 20 of them. The mean of 0.087 is marked.
Forward horizonMean rank ICIC > 0Top–bottom quintile spreadBootstrap 95% CI (IC)Adjusted p-valueEvidence status
5 days0.06159%+1.3%−0.011 to 0.1400.072Exploratory; interval includes zero
10 days0.05756%+1.4%−0.016 to 0.1310.072Exploratory; interval includes zero
21 days (traded horizon)0.08759%+3.9%0.024 to 0.1550.003Primary, pre-registered
63 days0.07169%+6.9%Not reported—Limited history (10 independent periods)

The 2025 anomaly, still there

Split by calendar year, the 21-day IC was 0.158 in 2024 (11 evaluations, positive in 73%), 0.005 in 2025 (13 evaluations, positive in 46%) and 0.117 in 2026 (10 evaluations, positive in 60%). In 2025 the score had essentially no ability to rank the whole universe, and the portfolio still returned +48%. The strategy does not trade the whole ranking. It trades the top ten. A factor can lose its relationship across the middle of the distribution and still identify the extreme winners. A year in which the signal goes quiet is also the year a momentum book is most exposed to a reversal. 2025 was that year inside this sample. October 2026 was a reversal inside a year whose average IC is still positive.

Trading statistics

Three hundred and twenty round trips. About seven in ten were winners.

The blotter contains 477 fills: 241 buys and 236 sells, across 34 rebalances and 35 order days. The run’s own round-trip count is 320, with a win rate of 69.4% (222 wins and 98 losses). Lot-matching the same fills gives the same 320 trips. Winners average about +47% and losers about −13%, a payoff near 3.6. Gross realised gains were about $1.30 million against gross realised losses of about $0.50 million, a profit factor of 2.6. Mean return per trip was about +29%. Median holding period 57 calendar days, mean 78.

Sixty-seven trips returned more than 50%, thirty-eight more than 100%, and ten lost more than 30%. Equal weighting and monthly re-ranking mean a losing position is reduced or removed at the next rebalance, while a winning one stays until its rank fails. The fills stop with the 1 October book. The ten names selected for November are a separate ranking, scored on 30 October, and they are listed in the current-book section.

Five largest realised gains
SymbolOpened → exitedReturn on the lotRealised P&L
MU (Micron)3 Feb 2026 → 2 Jun 2026+153.7%+$43,835
ASTS (AST SpaceMobile)4 Feb 2025 → 2 Jul 2025+97.8%+$43,599
MSTR (Strategy)2 Feb 2024 → 4 Mar 2024+166.7%+$41,180
PLTR (Palantir)3 Jan 2025 → 5 Jan 2026+117.8%+$37,930
VST (Vistra)2 Feb 2024 → 2 Oct 2024+181.3%+$31,912
Five largest realised losses
SymbolOpened → exitedReturn on the lotRealised P&L
AAOI (Applied Optoelectronics)2 Jun 2026 → 4 Aug 2026−35.0%−$49,751
WULF (TeraWulf)2 Jun 2026 → 4 Aug 2026−28.8%−$38,888
PL (Planet Labs)2 Apr 2026 → 4 Aug 2026−36.4%−$33,001
CORZ (Core Scientific)3 Dec 2024 → 2 Apr 2025−48.9%−$29,839
CRDO (Credo)2 Dec 2025 → 5 Jan 2026−25.6%−$23,440

Gains and losses are lot-matched from the order blotter and net of commission and slippage allocated to the shares closed. Dollar P&L is larger late in the sample because the book was larger. Applied Optoelectronics is both the largest realised loss and a current holding: the June lot was sold in August, and the name was bought again in September.

Turnover and costs

On average 4.2 of the 10 names change at each monthly rebalance (minimum 1, maximum 8, across the 33 rebalances after the first; none left the book unchanged). One hundred and six distinct names passed through the book. One-way turnover averages 44% of net asset value per month, about 528% annualised. The busiest rebalances were 4 September 2024, at 82% of NAV, and 5 January 2026, at 71%. Modelled costs were $2,952 of commission and $2,952 of slippage, $5,903 in total, on $19.4 million of notional. That is 3.1 basis points of notional, or about 0.30% of average NAV per year. It is a light cost model. A live book would pay more in spread on the smaller names, and a much larger book would move prices in some of them.

One-way turnover as a percentage of net asset value at each monthly rebalance, through October 2026.
One-way turnover at each rebalance. The average of 44% is marked. The two highest bars are 4 September 2024 (82%) and 5 January 2026 (71%).

Attribution

Where the 381% came from, and what October took back.

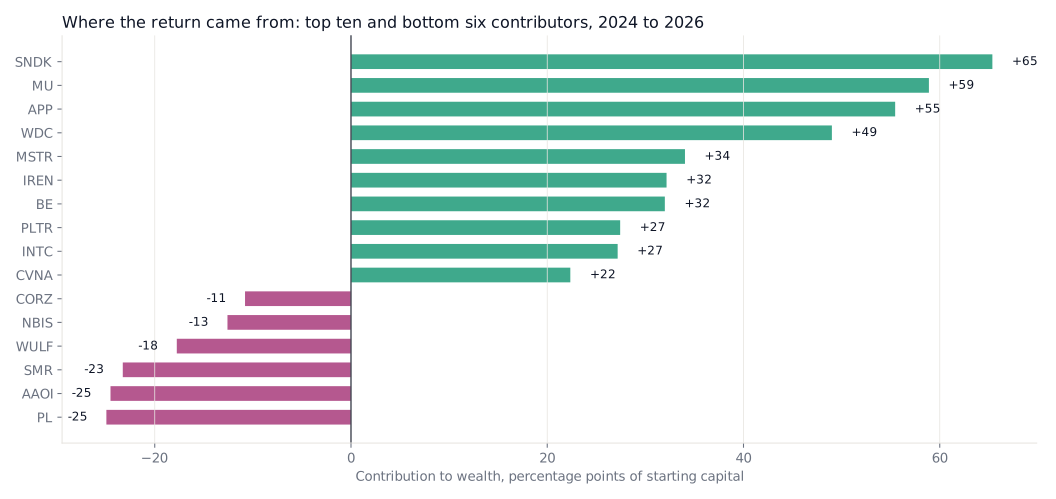
Summing each name’s daily weight times its daily return, scaled by the book’s wealth at the time, gives an additive contribution in points of starting capital. Across 106 names the contributions sum to 406 points. The compounded total return is 381%. The gap is costs and the difference between an additive sum and a compound. Seventy names added value and thirty-six subtracted. The ten largest contributors are 87% of the net additive total: AppLovin, Micron, SanDisk, Western Digital, Strategy, IREN, Bloom Energy, Palantir, Intel and Carvana.

The bottom of the table changed in October. Applied Optoelectronics is the worst lifetime contributor, at −46 points, and it was in the book that earned that month. United Microelectronics, at −22, and AMD, at −10, were bought on 1 October and lost in the same month. The ranking dated 30 October keeps United Microelectronics and drops Applied Optoelectronics and AMD.

Horizontal bar chart of the largest positive and negative contributors to the strategy through October 2026.
Contribution in points of starting capital, from the path through 30 October. Applied Optoelectronics is the largest subtraction. The 30 October selection drops it.
Top contributorsPointsBottom contributorsPointsLongest tenuresRebalances held
APP AppLovin+56AAOI Applied Opto.−46APP AppLovin17
MU Micron+47PL Planet Labs−25VST Vistra12
SNDK SanDisk+42SMR NuScale−23PLTR Palantir12
WDC Western Digital+36UMC United Micro.−22RKLB Rocket Lab11
MSTR Strategy+34WULF TeraWulf−18WDC Western Digital10
IREN+32NBIS Nebius−13CVNA Carvana9
BE Bloom Energy+32CORZ Core Scientific−11NVDA NVIDIA9
PLTR Palantir+27AMD Adv. Micro Devices−10HOOD Robinhood9
INTC Intel+27VISN−10BE Bloom Energy9
CVNA Carvana+22VKTX Viking Therap.−10MU Micron9

Points are rounded to the nearest point. They sum to 406 across all 106 names; the compounded total return is 381.3%. Tenure counts rebalance dates on which the name was held, not necessarily consecutive. AST SpaceMobile was also held on 9 rebalance dates.

Selected for this month

The ten names selected for November, scored on 30 October 2026.

The path through 30 October was earned by the 1 October book: SanDisk, Micron, ASE Technology, ImmunityBio, Western Digital, Dell, Roivant, AMD, United Microelectronics and Applied Optoelectronics. That book is what lost 20.7% in October. The selection for this month is a fresh ranking from the same run, dated 30 October 2026, over 66 names. Ten names are chosen, each at 10%.

Six names stay. SanDisk is still first, with a score of 112.47 against 161.17 on 1 October. United Microelectronics rises from ninth to third. Micron, ASE Technology, Dell and Western Digital stay, with Western Digital now tenth. Four names leave: ImmunityBio, Roivant, AMD and Applied Optoelectronics, the last of those the worst lifetime contributor in the path above. Four names enter: Hewlett Packard Enterprise, Intel, Teva Pharmaceutical and Cenovus Energy. Intel was sold at the 1 October rebalance and is selected again. The new book is still mostly the memory, foundry and server complex, with a generic drug maker and a Canadian oil producer as the two names outside it.

Horizontal bar chart of the ten names selected for November 2026, ranked by momentum score as of 30 October 2026.
Selected for November. Scores as of 30 October 2026, from the same run. Every position is 10%. These weights are the selection, not fills inside the 711-session path.
RankTickerCompanyMomentum scoreWeightVersus the October book
1SNDKSanDisk112.4710.0%Stays, was rank 1
2MUMicron Technology68.9010.0%Stays, was rank 2
3UMCUnited Microelectronics61.2310.0%Stays, was rank 9
4ASXASE Technology Holding51.8110.0%Stays, was rank 3
5DELLDell Technologies47.0010.0%Stays, was rank 6
6HPEHewlett Packard Enterprise44.9910.0%Selected this month
7INTCIntel43.5810.0%Selected this month
8TEVATeva Pharmaceutical43.2110.0%Selected this month
9CVECenovus Energy40.0710.0%Selected this month
10WDCWestern Digital39.6810.0%Stays, was rank 5

Scores and weights as of 30 October 2026, bundle dated 1 November 2026, same run as the path above. Leaves the book: ImmunityBio (IBRX), Roivant Sciences (ROIV), Advanced Micro Devices (AMD) and Applied Optoelectronics (AAOI).

Method

What was actually run.

The book was run on the NYSE calendar at daily frequency with a 756-day data window, on adjusted close prices from the historical price bundle dated 1 November 2026. The window is 2 January 2024 through 30 October 2026, 711 sessions. The signal is the three-horizon momentum score close_qsmom_21_252_126. The portfolio is equal-weight, long-only, 10 positions, rebalanced on the first trading day of each month after the open. Transaction costs: commission $0.005 per share, slippage modelled as a $0.01 spread. Thirty-four rebalance days are in the order blotter, the last on 1 October 2026. The benchmark is SPY on the same calendar. Starting capital is $200,000.

Validation artefacts from the same run: the factor validation time series (134 observations across four horizons), the moving-block bootstrap (1,000 resamples, 95% intervals, with the 21-day IC marked primary and the 63-day horizon marked limited history), the calendar sub-period table (24 observations), the day-level drawdown attribution (597 drawdown-days), the per-asset return history (7,100 symbol-days) and the target-weight history (340 symbol-rows, 34 snapshots). The path itself held the 1 October book. A separate ranking from the same run, dated 30 October, selects the November book from 66 names. Portfolio-level statistics in the comparison table are the run’s own. The regression, the rolling-window counts, the lot-matched blotter and the contribution points were computed from the daily series, the order blotter and the asset-return history of this run.

This is the production 10-name sleeve for the November 2026 research series: long only, liquid US names, the same rules as the prior edition, with October included as a full month.

Interactive Plotly tear sheets from the same run:

What this is not

This is a backtest, not a live composite. Costs are modelled, and modelled lightly: a half-cent commission and a one-cent spread understate what a large book would pay in the smaller names on this list. The sample is 2.8 years and is dominated by an AI-infrastructure and memory-cycle leadership regime. The beta of 2.02 means a broad market decline lands harder here than in the index, before any selection effect. October showed the selection effect on its own: the index fell 0.9% and the book fell 20.7%, and the trailing year, the trailing six months and the trailing three months are all behind the benchmark. Monthly Sharpe is now higher for the index than for the book. The 252-session return has gone negative for the first time in this series. The 21-day rank IC is still the registered endpoint, its interval still excludes zero, and the run still withholds a confidence interval at the 63-day horizon. Past simulated returns are not a promise of future returns. Nothing here is an offer, a solicitation, or advice.

Research Newsletter

Subscribe to Quantitative Dispatches

Receive research papers, macro analysis, and algorithmic risk models. Zero spam, strictly high-signal quantitative analysis.

Subscribed: You have been added to the Vanderholt Technologies Limited quantitative research dispatch distribution list.

Have a Research Collaboration or Inquiry?

Connect directly with our quantitative modeling team, Islamic fintech desk, or AI agent protocol developers.

Contact the Desk Explore Strategies